

KPI definitions, dimensions, filters and drill-downs
EYAN digital service
Dashboards & Reports
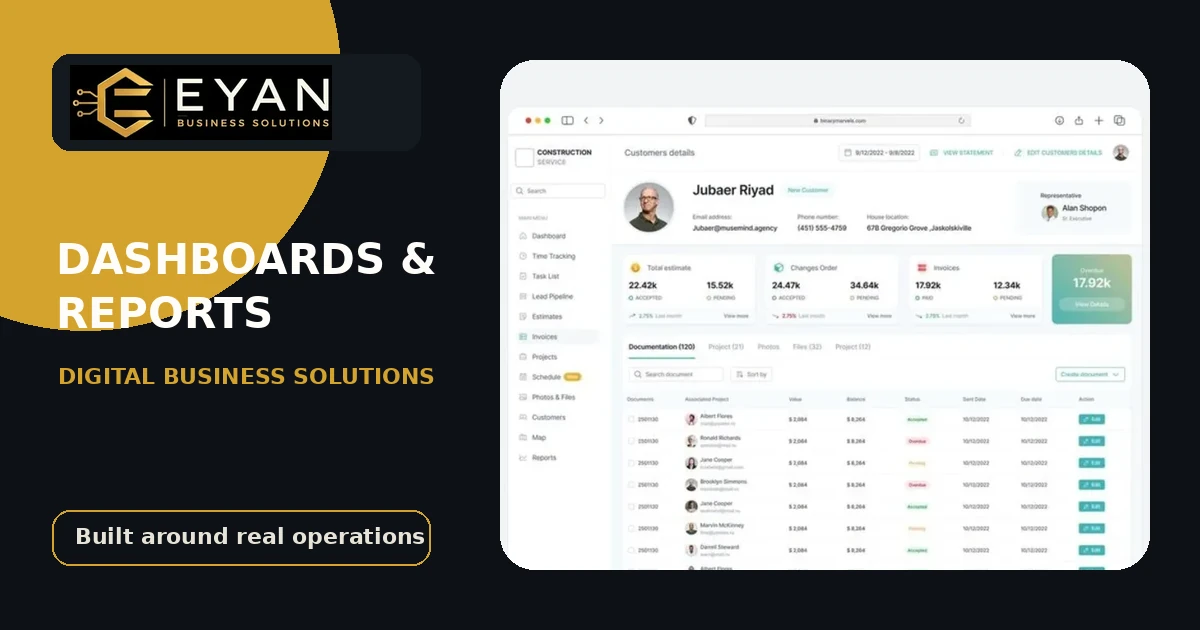
Business dashboards and reports for sales, stock, users, branches, customers, expenses and operational performance, built from governed data.
business dashboard developmentKPI reportssales and inventory dashboardmanagement reporting
Who this service fits
- Owners who need remote operational visibility
- Businesses with delayed manual reports
- Teams that need one definition for KPIs and totals
Problems it addresses
- Reports arrive after decisions are needed
- Different files produce conflicting totals
- Owners cannot see branch, user or stock exceptions quickly
Core capabilities
Sales, stock, users, branches and customer reporting
Exception indicators, thresholds and alerts
Mobile-friendly owner monitoring
Data quality, refresh, reconciliation and access controls
How delivery works
- 01
Decision and KPI discovery
- 02
Data source, quality and ownership analysis
- 03
Metric modeling, dashboard design and engineering
- 04
Reconciliation, performance testing, release and continuous refinement
Expected deliverables
- Reporting questions and KPI dictionary
- Source-data assessment and metric rules
- Dashboard UX, data queries and access controls
- Validation totals, training and operating documentation
Potential integrations
- POS, ERP, CRM and e-commerce data
- Files, databases and APIs
- Scheduled reports, notifications and exports
Service-specific questions
Can a dashboard fix poor data quality?
No. It can expose problems, but reliable dashboards require governed capture, definitions, ownership and reconciliation.
Can each user see different data?
Yes. Role, branch, organization and record-level access can be applied.
Can owners use dashboards on mobile?
Yes. Priority indicators and navigation are designed for mobile monitoring when the data and hosting model support it.
Remote freelance delivery with no public walk-in address